Start networking and exchanging professional insights

Register now or log in to join your professional community.

Follow

How to Insert Chart in an Excel Sheet?

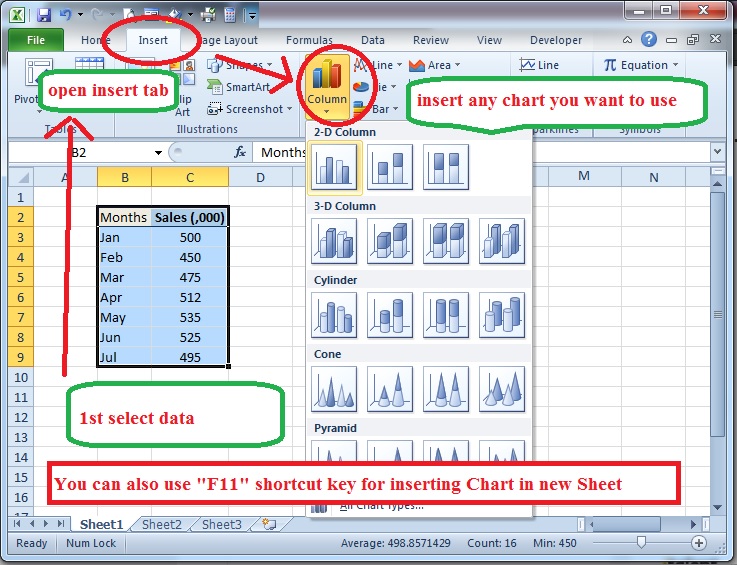
By going through the following navigation we can insert CHART : Excel Sheet + Insert + Chart

user-image
Question added by Zafar Iqbal , Teacher (Pak Studies) Subject Specialist , Home Tutor
Date Posted: 2013/09/23
Zafar Iqbal
by Zafar Iqbal , Teacher (Pak Studies) Subject Specialist , Home Tutor

Thank you all for participation in answering this question.  Yes agreed we can spend our weekend at bayt.com by participation in question/answer session.

Muhammad Safdar
by Muhammad Safdar , Accountant & Inventory Control , SURGITECH MEDICAL SUPPLIES LLC

Method 1,

  1. select data for which you want to insert chart,
  2. go to Insert Tab, and click on Column
  3. Now select any chart type, you want to use

Method 2,

  • Select required data for chart,
  • Now simply press "F11" key (to insert chart in new sheet)

How to insert chart in Excel

Open Excel click insert tab  take chart option which you can find different type of chart model.

Mohamed Jamsheer
by Mohamed Jamsheer , Head of the department Supply chain, logistics & Warehouse , ETRONIX MIDDLE EAST LLC (CLIKON)

select table.

goto insert tab.

select type of chrts.


i

MOHAMED EZZ EL DEEN MOHAMED
by MOHAMED EZZ EL DEEN MOHAMED , NOC Engineer , huawei egypt

from insirt 

krushnasinh chavda
by krushnasinh chavda , General Accountant , Pixel Digital Systems LLC - UAE

    1. Select the cells you want to chart, including the column titles and row labels. These cells will be the source date for the chart.

    2. From the insert tab, click the desired chart command.

    3. Choose the desired chart type from the drop down menu.

    4. The selected chart will be inserted in the worksheet.

Muhammad Adnan Khan
by Muhammad Adnan Khan , HSE Officer , Transguard Group LLC

by using ALT+N then R key from key board

Bilal Arif
by Bilal Arif , Chief Accountant , Etad United Co for Commerce and Development

Select required data which you want to insert on to the chart.

  • Now simply press "F11" key (to insert chart in new sheet)

Inexcel we willselect data and then click insert and click chart. we have some other charts as well. Column Line Pie Bar and Area are default charts in excel

Mohammad Mukarram
by Mohammad Mukarram , Sr. Technical Support Engineer , The Warehouse Group Ltd

Adding a Default Chart to the Current Worksheet with Alt + F1 Select the data you want to use in the chart; Press and hold down the Alt key on the keyboard; Press and release the F1 key on the keyboard; The default chart is added to the current worksheet.

More Questions Like This

Do you need help in adding the right keywords to your CV? Let our CV writing experts help you.